条形图和堆砌条形图。
import numpy as np
import pandas as pd
import matplotlib.pyplot as plt
df = pd.DataFrame(np.random.rand(6, 4),
                   index = ['one', 'two', 'three', 'four', 'five', 'six'],
                   columns = pd.Index(['A', 'B', 'C', 'D'], name='Genus'))
df
Output :
| Genus | A | B | C | D |
|---|---|---|---|---|
| one | 0.981403 | 0.441834 | 0.081178 | 0.654600 |
| two | 0.295319 | 0.677140 | 0.185448 | 0.811627 |
| three | 0.030288 | 0.251568 | 0.284908 | 0.458905 |
| four | 0.420061 | 0.507302 | 0.659266 | 0.535509 |
| five | 0.595809 | 0.338925 | 0.078260 | 0.127593 |
| six | 0.629275 | 0.499551 | 0.301029 | 0.106009 |
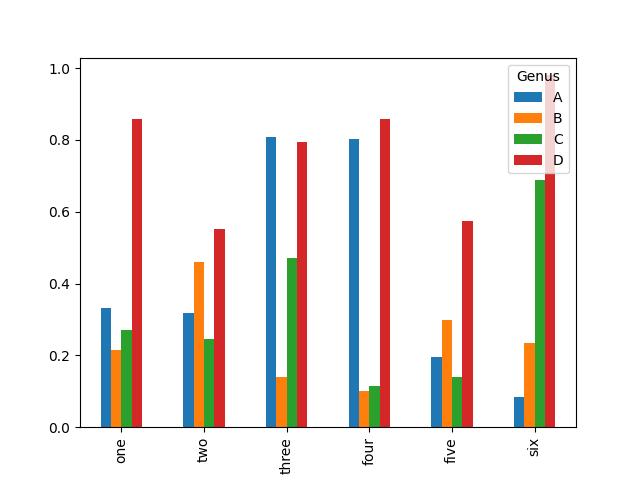
df.plot.bar()
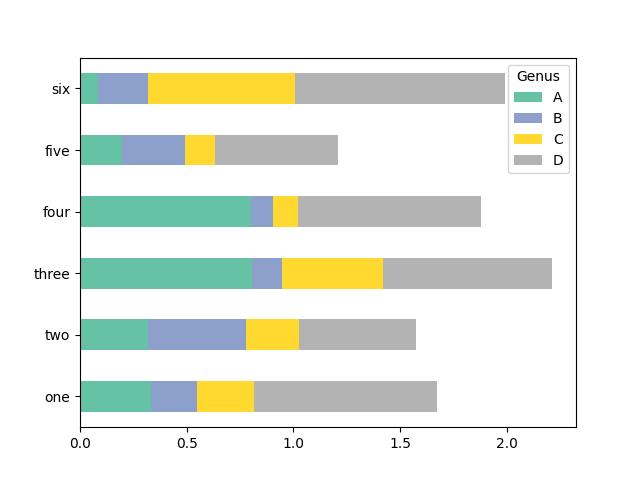
df.plot.barh(stacked=True, cmap='Set2')